
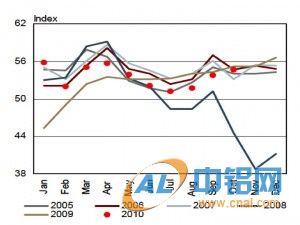
Purchasing Manager indexes are always closely followed but none more than those for China when looked at in reference to the commodities markets. The belief is a positive China PMI reading is bullish for metals and other commodities. But is that right? Well a note this week by Standard Bank to investors provided a very useful chart mapping the PMI over twelve month cycles year over year as reproduced here. As we can see the PMI and underlying economic activity follow the same seasonal cycle every year. Interestingly though in previous years, October has been lower than September but this year October has continued to rise possibly because the summer trough was lower than in previous years, with the obvious exception of the crash of 2008.
China’s October PMI came in at 54.7 higher than an expected 53.8 and followed two months of rising readings in August and September. Ironically China’s has been rising again just as Europe and the US has been falling, although all remain in positive territory.
The bank contends that all the base metals follow a good correlation to the Chinese PMI with aluminum followed by copper holding the closest correlation. In reality, the relationship is to the underlying conditions that drive both the PMI and the metal price/demand figures.
Prices dipped sharply in February as indeed did the PMI the month before, but then rose in late Q1/early Q2 before falling again during the summer. The bank suggests the highest correlation is with a 3 month lag so the current rise in the PMI could be supportive of price rises for aluminum and copper in Q4. With several other sources predicting the resumption in price increases in Q1 2011 the current level may prove to be a good time to be fixing forward contracts at prevailing levels.